Imaging systems shaped around the decision you need to make.

Profilocolore combines acquisition, calibration and analysis for markets where non-invasive understanding of surfaces, materials and colour creates critical operational value.

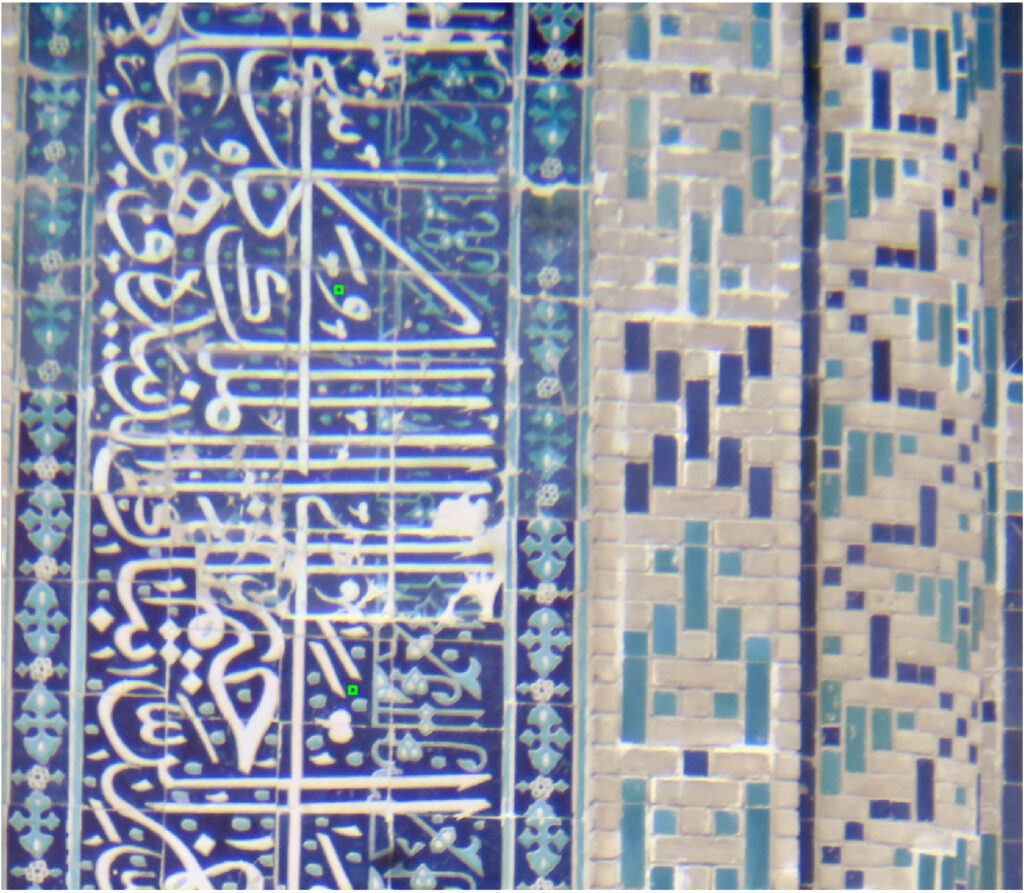
Detail of glazed tile decoration with blue calligraphy and two measured pointsSelected points

Point 1 · reflectance spectrum

350–950 nm · reflectance 0–100.20.40.60.813004005006007008009001000
Lab (D65) 39.41, 9.19, −37.16
Identified pigment: Indigo

Point 2 · reflectance spectrum

350–950 nm · reflectance 0–100.20.40.60.813004005006007008009001000
Lab (D65) 26.91, 15.88, −44.99
Identified pigment: Cobalt (ΔE 15.64)

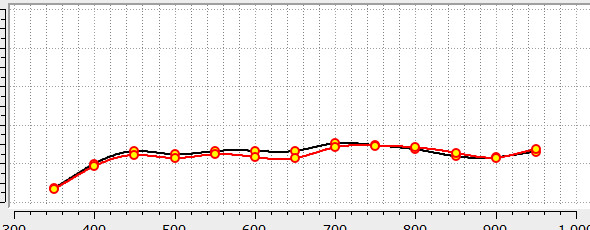
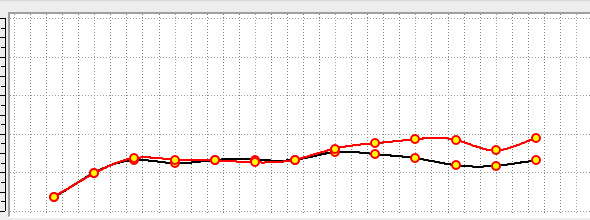
Spectral comparison · Point 1 vs Point 2

Similar blue in the visible range, different behaviour in the near-infrared · spectral similarity 76%00.20.40.60.813004005006007008009001000
Point 1Point 2

Project case study: multispectral analysis of the glazed tile decoration of a madrasa in Samarkand, Uzbekistan.
Cultural Heritage & Conservation

Map pigments, distinguish original materials from overpaints and monitor degradation, pixel by pixel, without physical sampling.

01Which pigments and materials differ?Reflectance spectra and Lab values are matched against a pigment reference library, point by point.
02Where are overpaints or previous interventions?Near-infrared behaviour reveals retouches that look identical to the original in visible light.
03How is the surface changing over time?Repeat campaigns are compared spectrally to quantify fading, darkening and loss as ΔE.
Non-invasive350–950 nmΔE monitoring
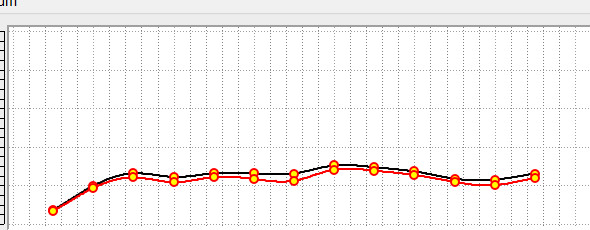
Sample 1 production and master selectionsProduction selectionMaster selection
Reflectance comparisonReflectance comparison for sample 1

02 / 03

Industry & Quality Control

Automate colour, reflectance and homogeneity inspection while revealing microscopic defects invisible to the eye.

  • Is the product within colour and reflectance tolerance?
  • Where is the process non-uniform?
  • Can defects or materials be classified automatically?
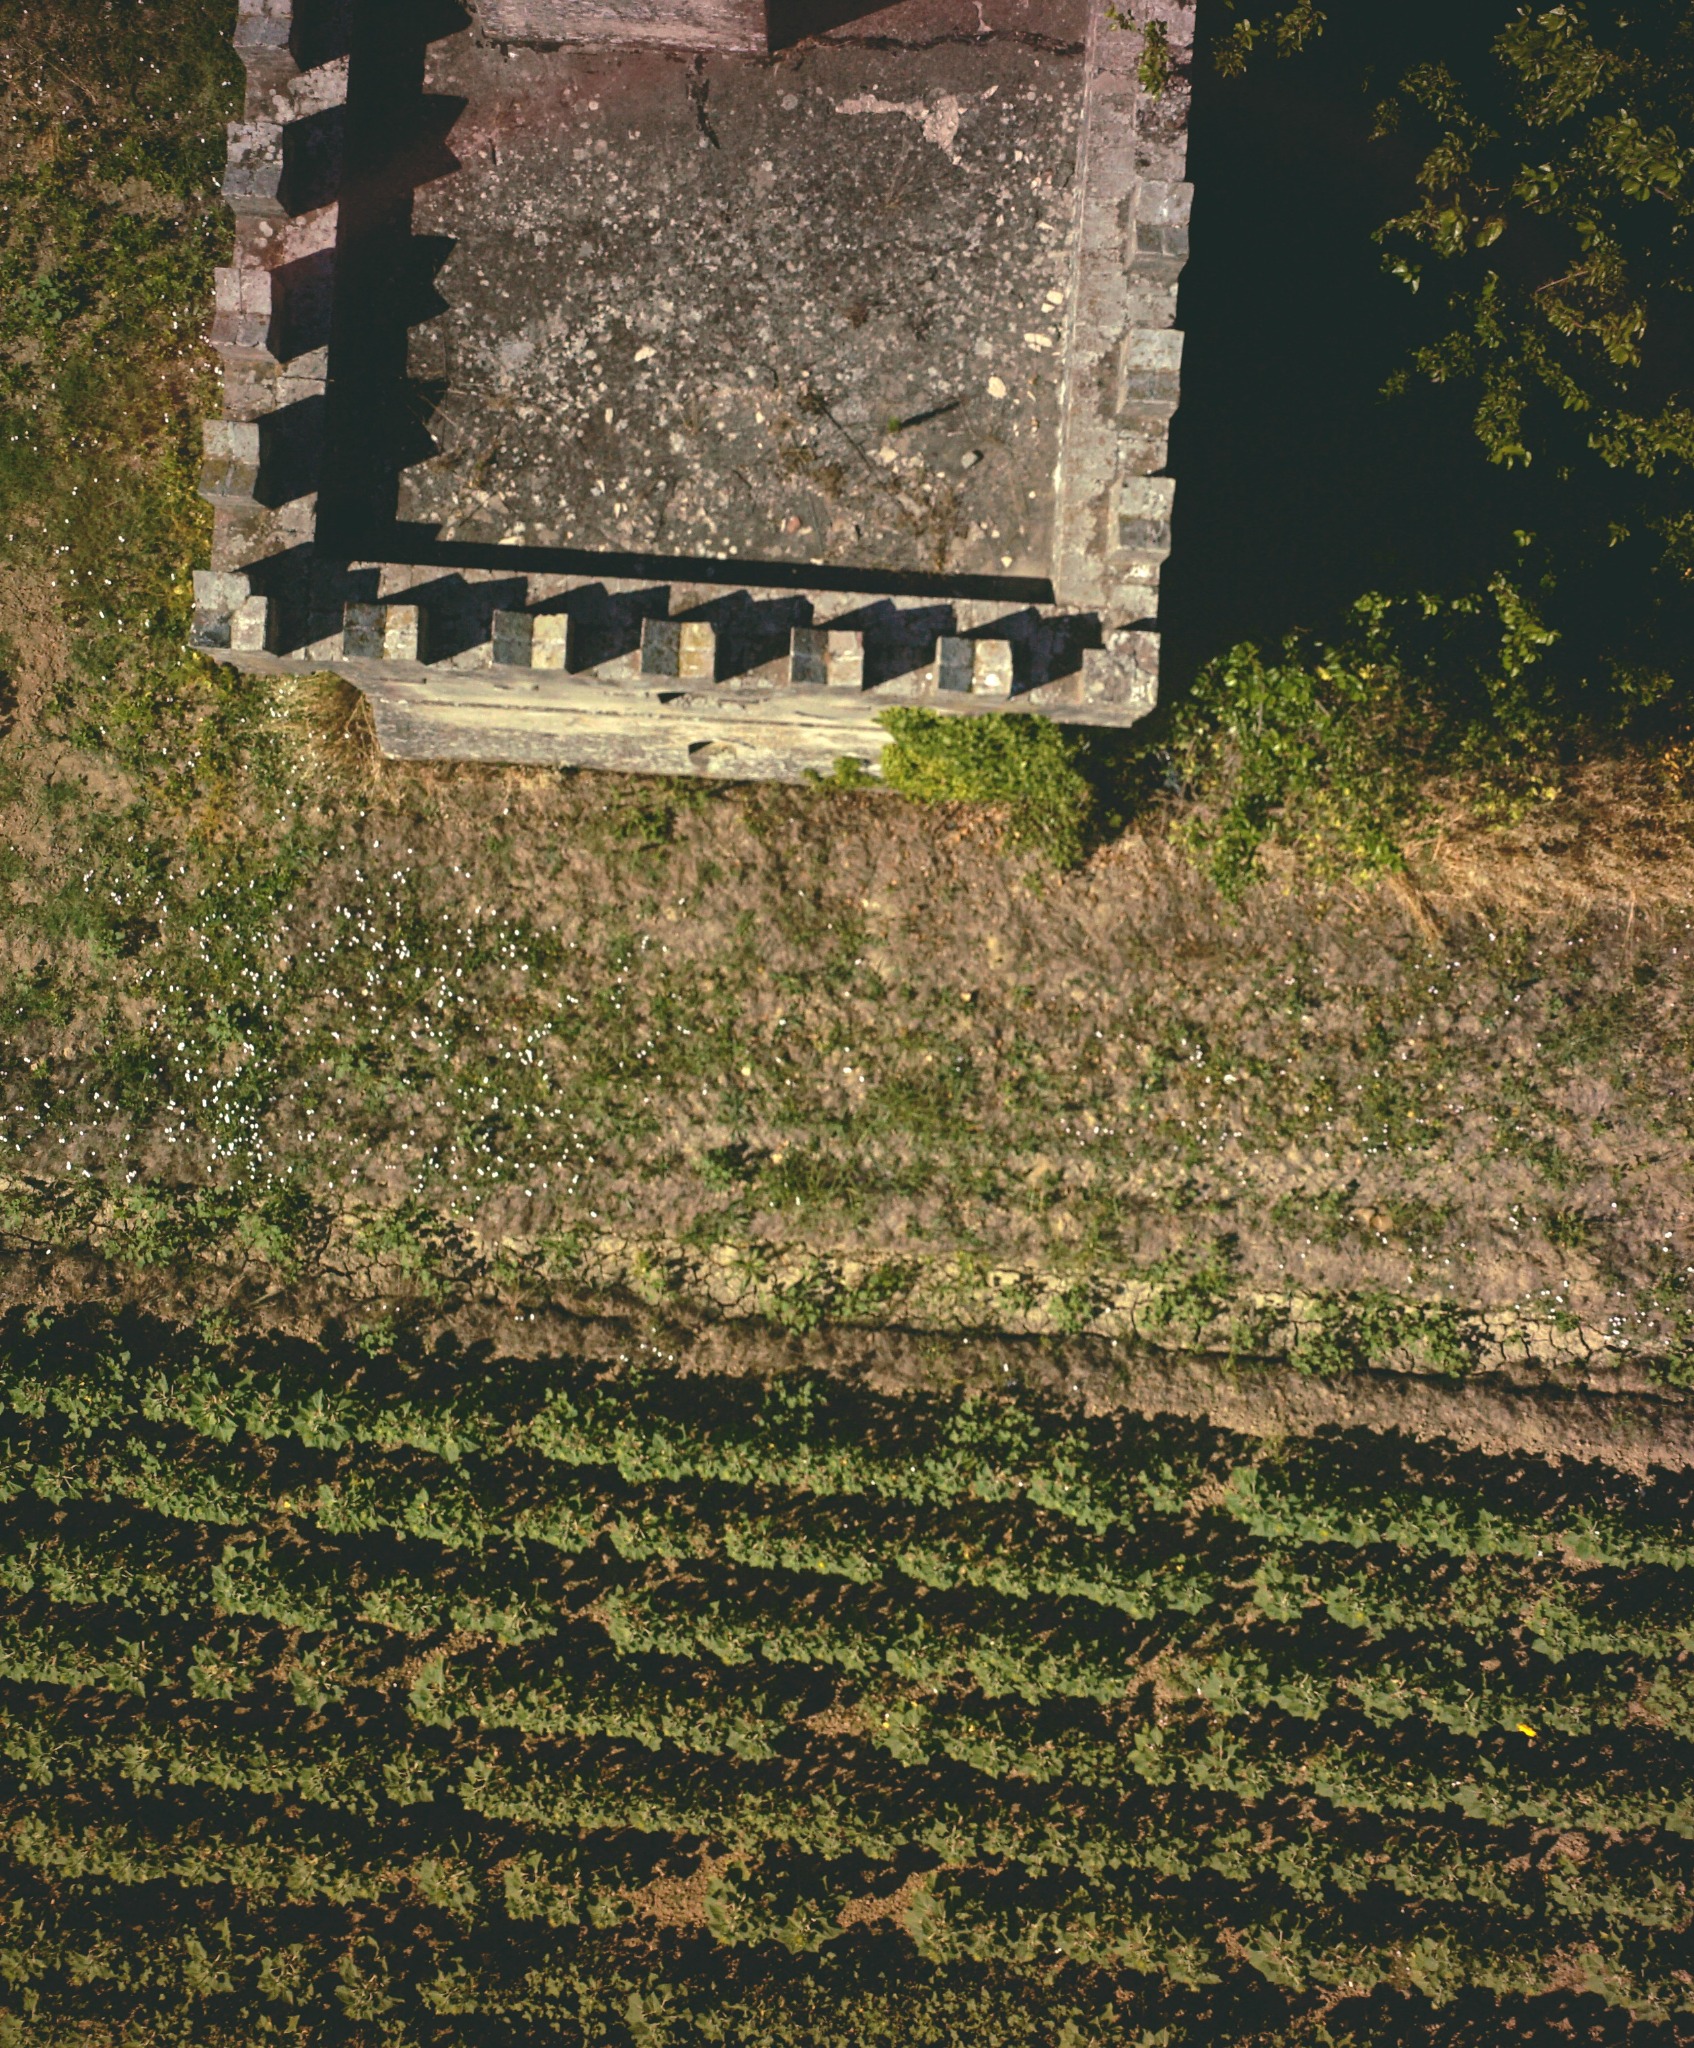
Visible-light aerial image of cultivated rows
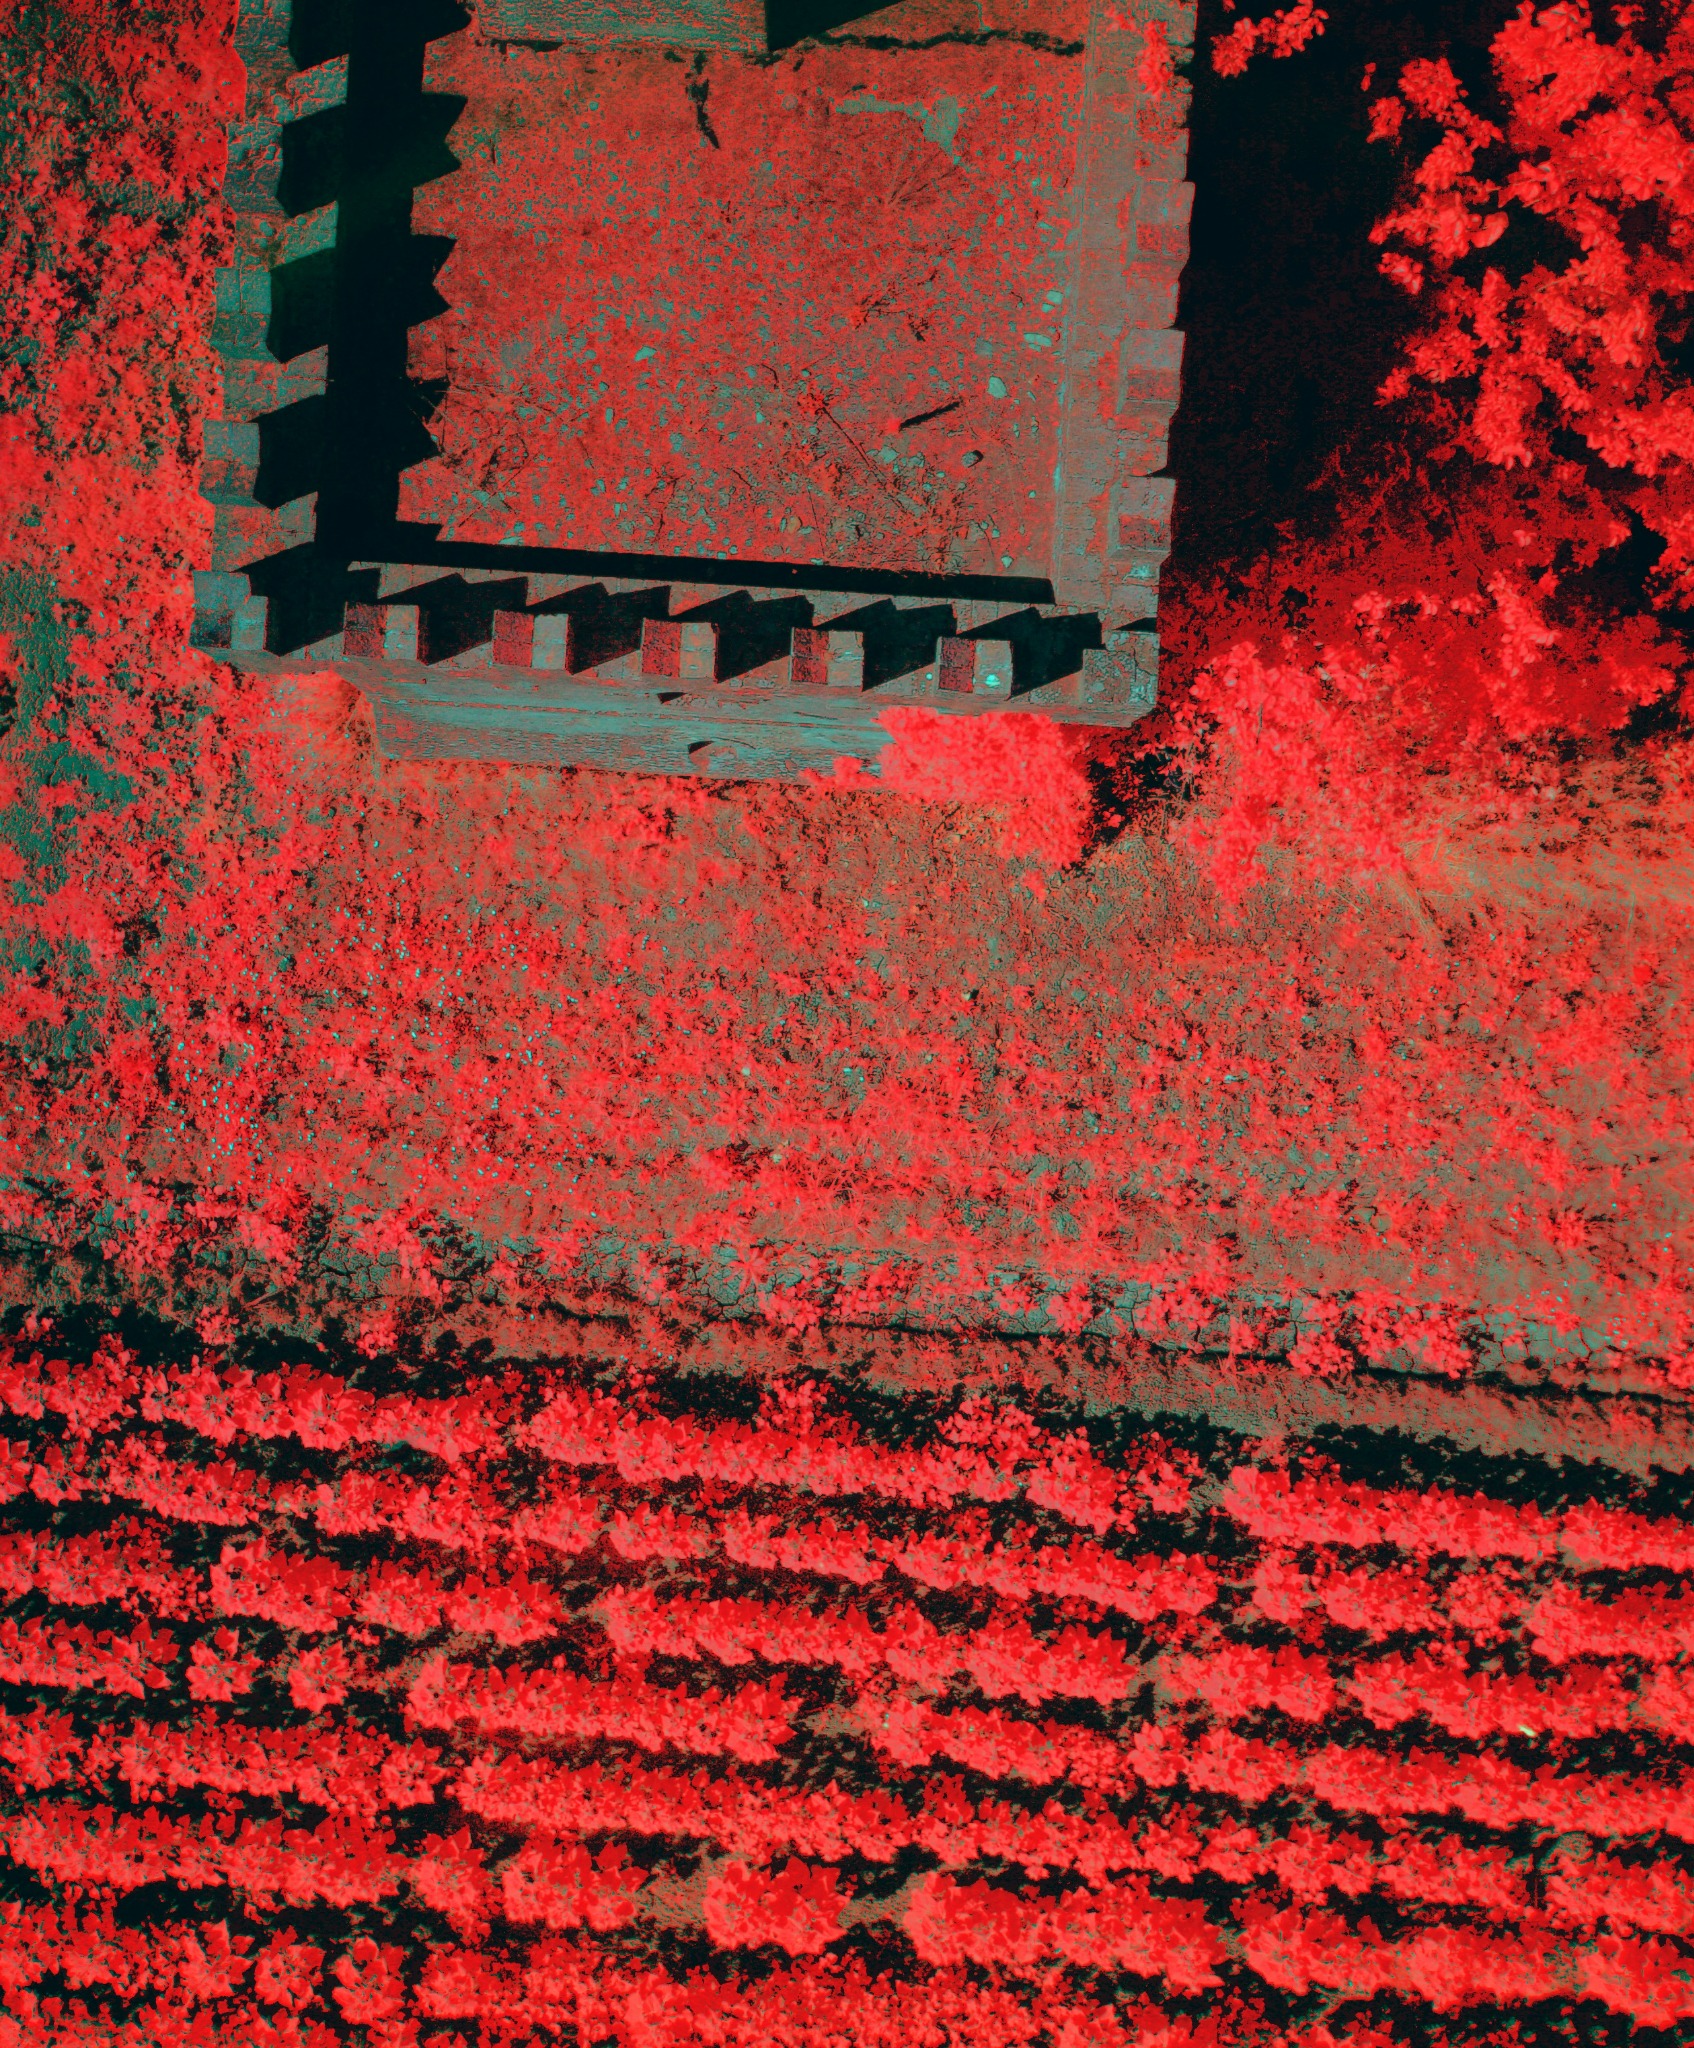
Near-infrared vegetation rendering of the same cultivated area
Before Visible imageAfter NDVI image Visible and vegetation-index evidence · Same calibrated scene

NDVI video from Profilocolore Patent-pending Dual Filter Lens followed by HMI processing

03 / 03

Precision Agriculture & Environmental Monitoring

Detect crop stress, analyse vegetation and support intelligent land management through calibrated remote sensing.

  • Where is crop stress emerging?
  • How does vegetation condition vary across the field?
  • Which areas require attention or resources?

YOUR APPLICATION

Start with the material and the question it needs to answer.