PickViewer

PickViewer is an advanced image viewing and processing software that allows the characterization and identification of materials photographed through the use of specific algorithms and mathematical functions. The images to load into PickViewer must have been previously processed with the SpectraPick software.

Among the most important functions of PickViewer are:
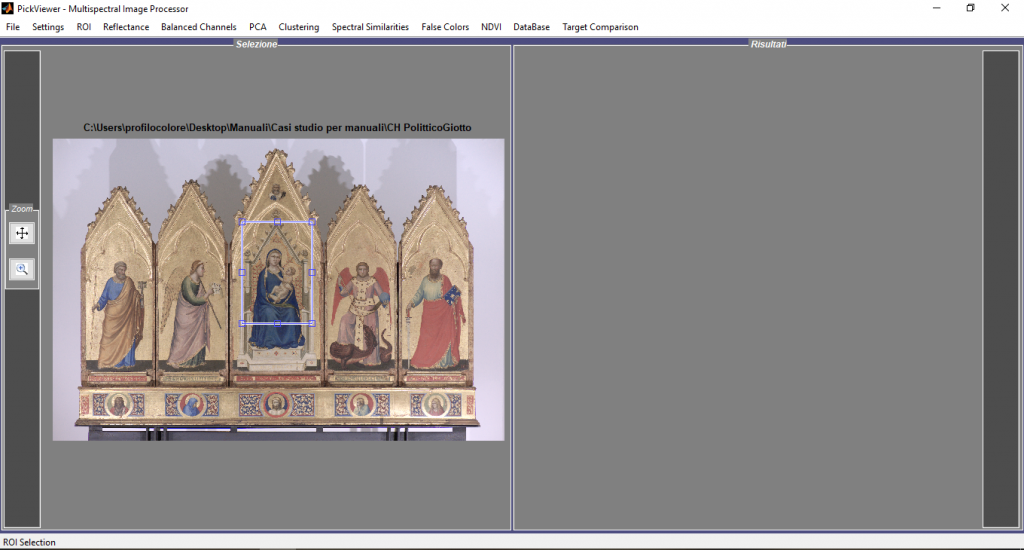
  • ROI – Region of Interest – This function allows to define and resize the area of interest to be analyzed; the cut can be saved and exported as additional documentation to the one already in possession;
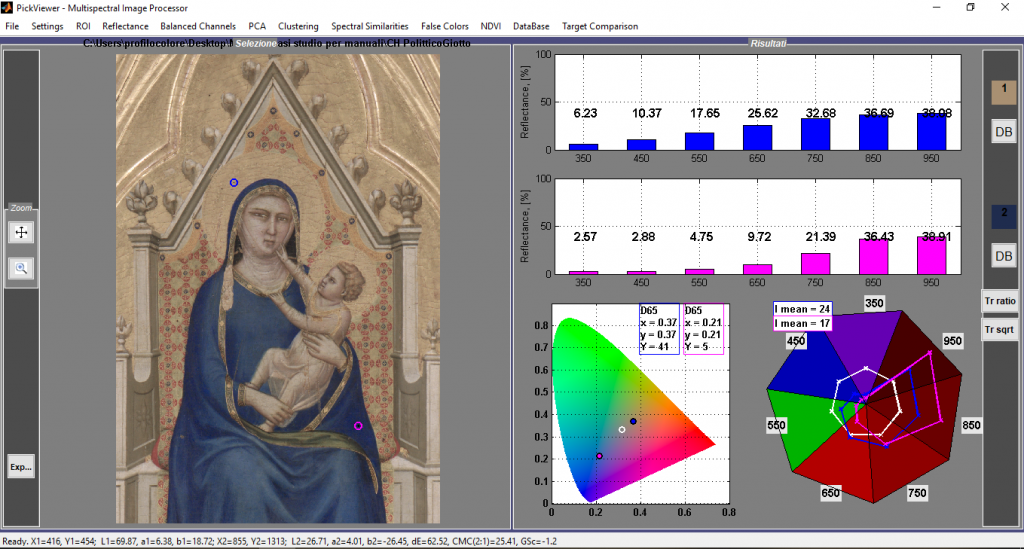
  • Spectral reflectance – This function allows to view calibrated radiometric and colorimetric information; moreover, it allows to compare the XYZ and Lab coordinates between two selected points and to visualize their DeltaE. The displayed results can be saved on a specific spectral database or added to an already existing one;
PickViewer Spectral Imaging Systems
ROI - Region of Interest.
PickViewer Spectral Imaging Systems
Spectral reflectance.
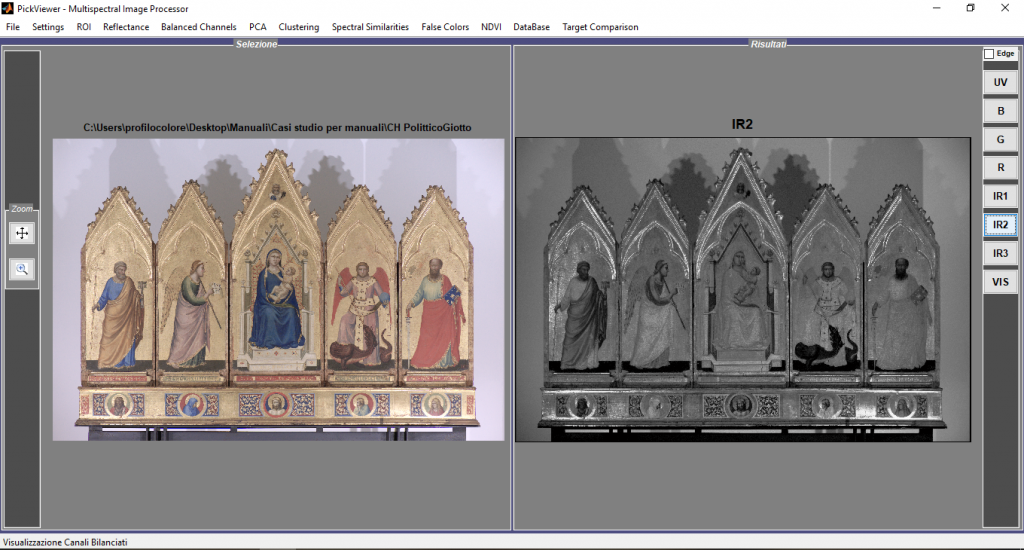
  • Balanced channels – The function allows the display of all the balanced channels loaded in the software in order to study the images in the different bands, being able to always display the visible image on the left and all the other bands on the right;
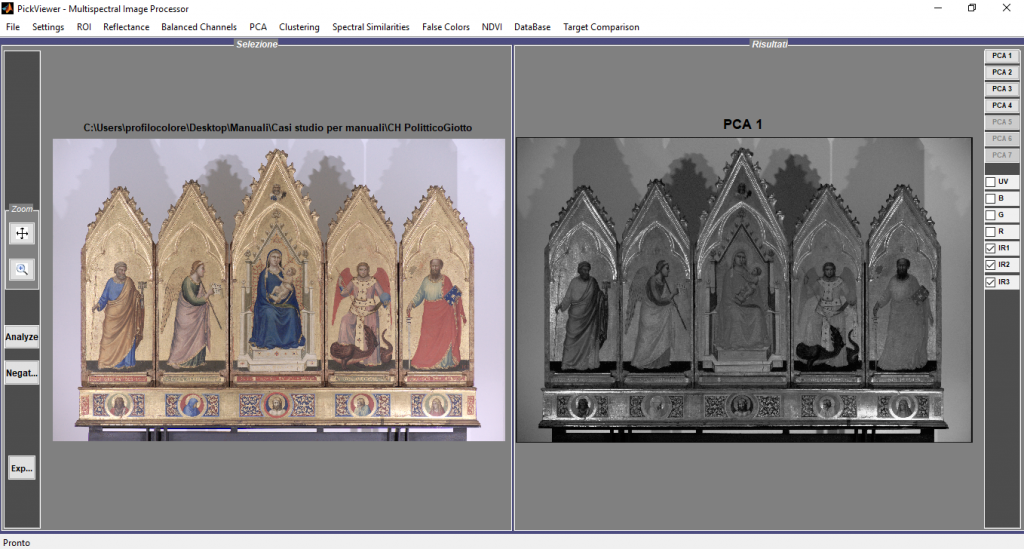
  • PCA – Principal Component Analysis – This is a statistical technique for reducing variables in order to maximize the amount of information that can be obtained. By selecting, therefore, all or some of the bands imported into the software, it is possible to maximize the results already obtained previously or to detect variations that could not be displayed up to that moment;
PickViewer Spectral Imaging Systems
Balanced channels.
PickViewer Spectral Imaging Systems
PCA - Principal Component Analysis.
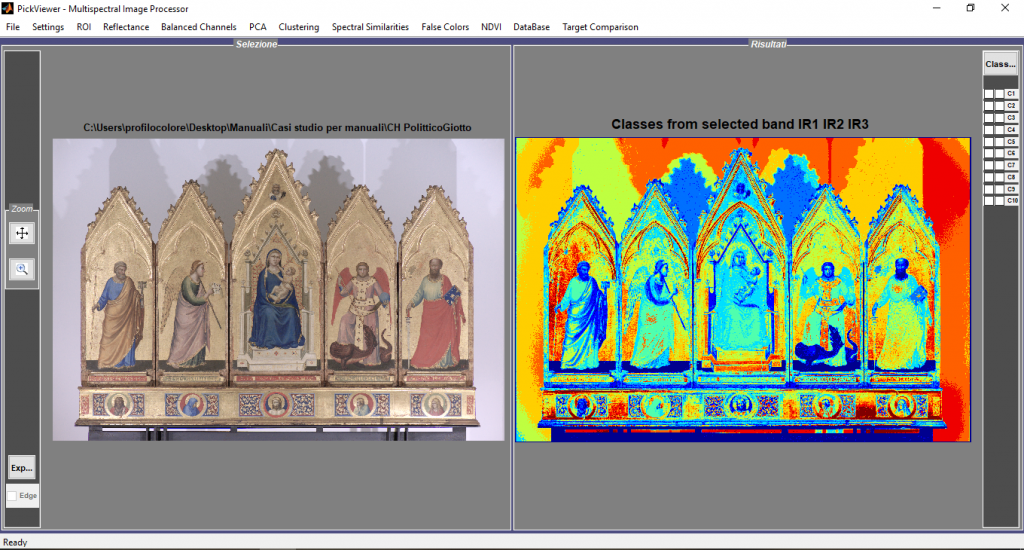
  • Clustering – Is a multivariate analysis technique aimed at grouping similar elements together in a set of data, in order to highlight the elements belonging to the same group, thus segmenting the different clusters. It is possible to read the average colorimetry for each class, extract the pixels belonging to a specific class and calculate the percentage of pixels per class;
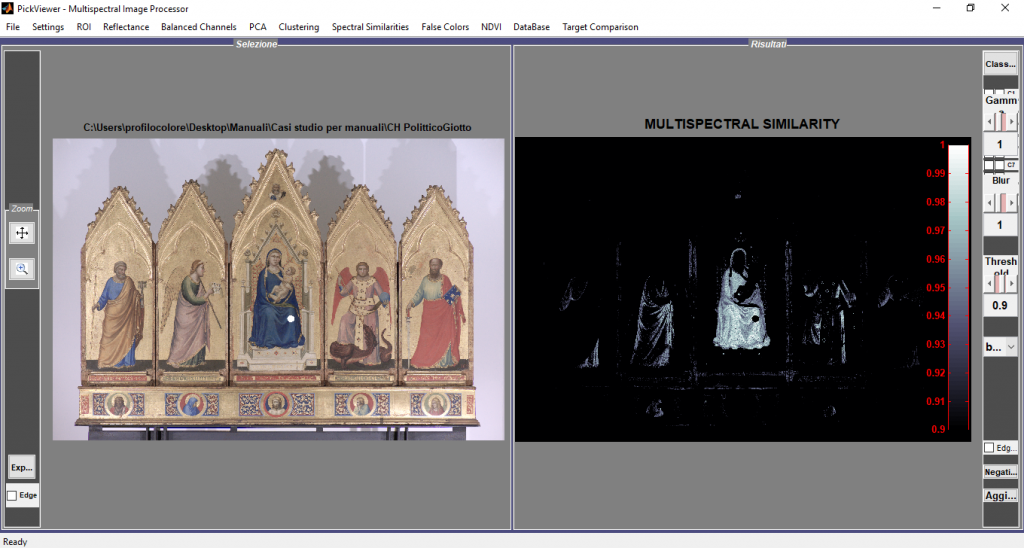
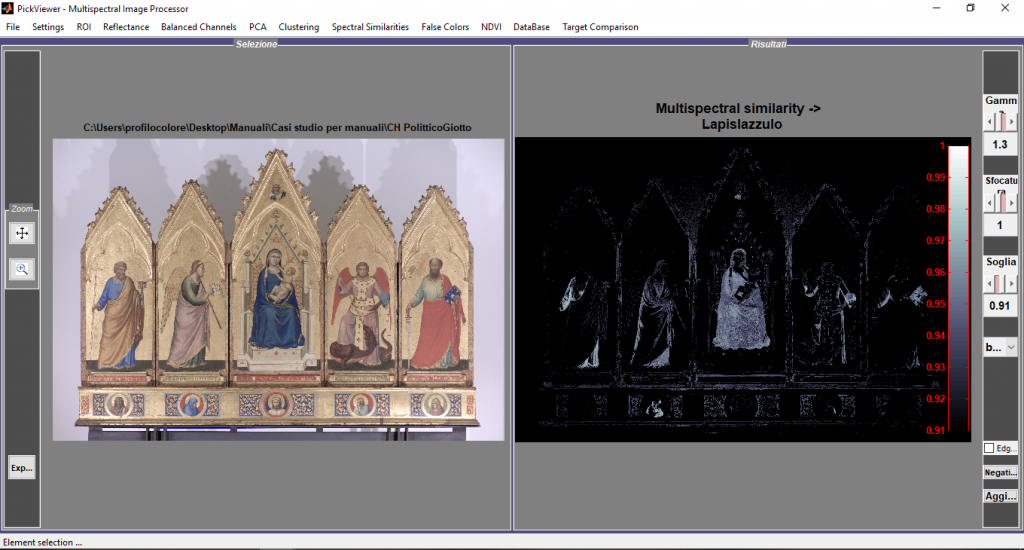
  • Spectral Similarities – Allows to display, starting from a selected point on the image, of all the spectral similarities present in the scene; it is possible to compare this information both from a multimetric, multispectral and colorimetric point of view;
PickViewer Spectral Imaging Systems
Clustering.
PickViewer Spectral Imaging Systems
Spectral Similarities.
  • NDVI – Normalized Vegetation Differential Index – This is a graphic indicator used in agriculture to assess the health of vegetation;
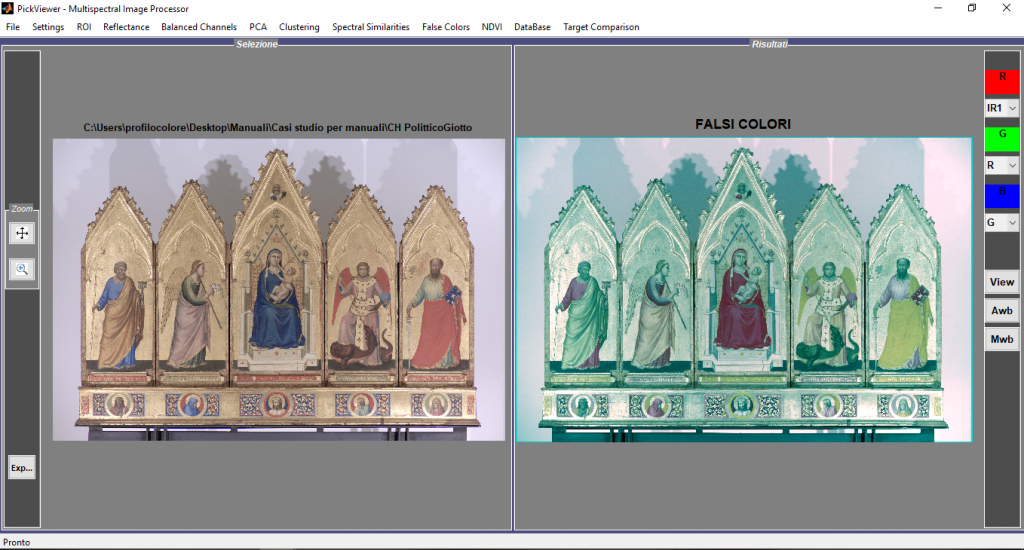
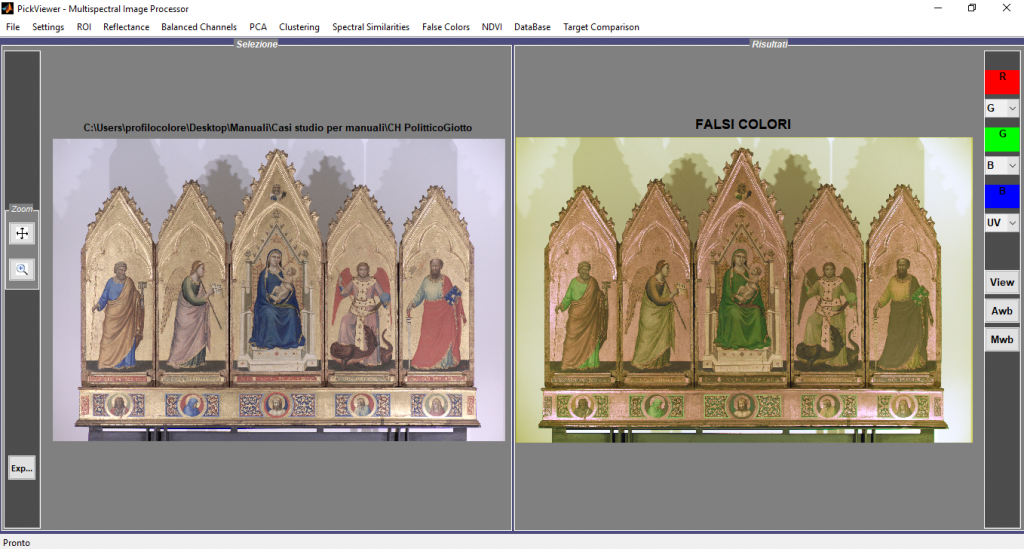
  • False Colors – Image visualization technique that allows, through the recombination of RGB channels and infrared or ultraviolet bands, to obtain new images that allow the distinction of pigments or substances similar to the naked eye but different from the multispectral point of view;
PickViewer Spectral Imaging Systems
False Colors IR.
PickViewer Spectral Imaging Systems
False Colors UV.
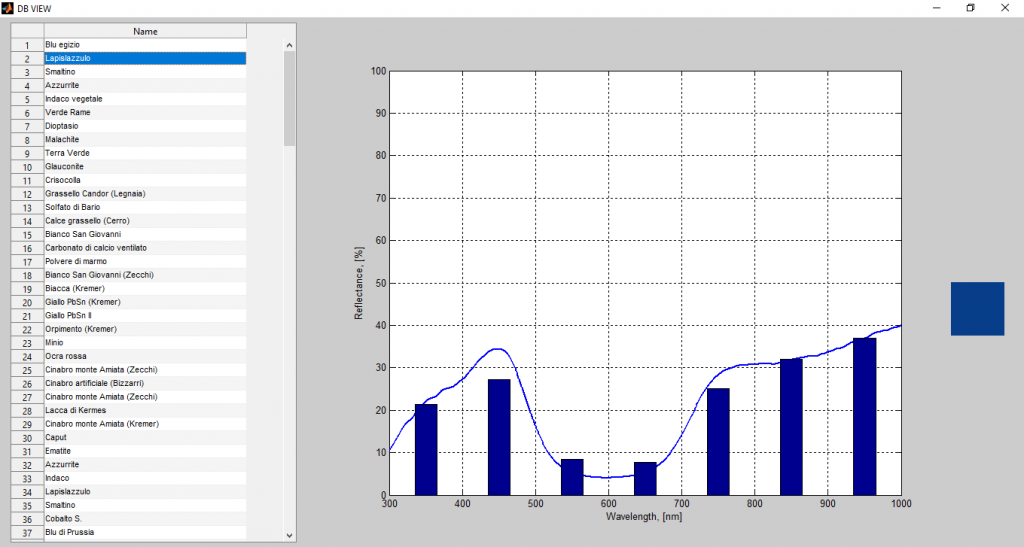
  • Database – Allows the recognition of the pigments present in the image under analysis by creating or loading existing databases.
PickViewer Spectral Imaging Systems
Database.
PickViewer Spectral Imaging Systems
Database - research lapis lazuli pigment.

To read the features of PickViewer