Automate colour, reflectance and homogeneity inspection while revealing microscopic defects invisible to the eye.
The decision this system supports.
Outcome: Move from subjective visual checks to consistent, image-wide measurement.
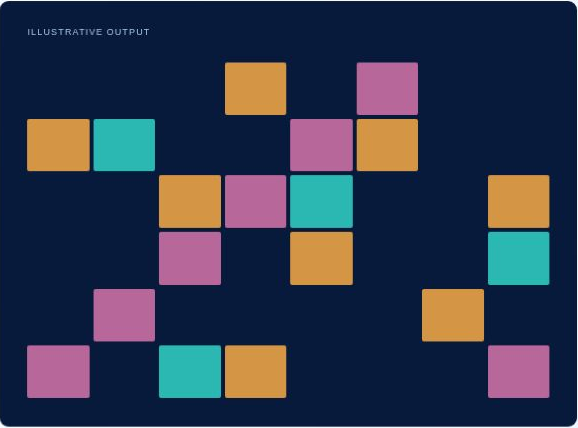
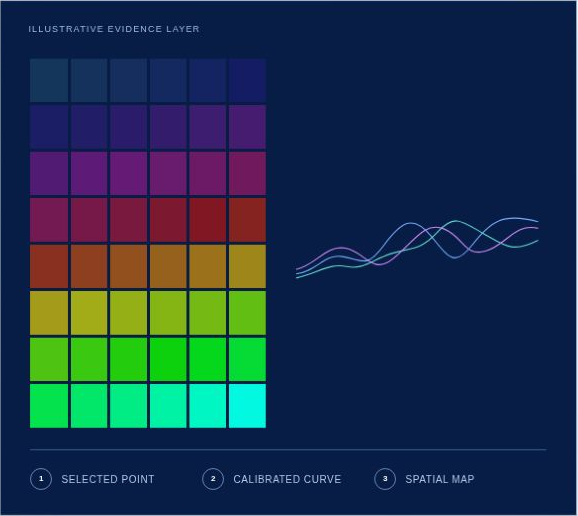
Evidence: Defect maps, chromatic and radiometric compliance, and material classification indicators.
Illustrative range: visible–NIR
Questions to answer
Is the product within colour and reflectance tolerance?
Where is the process non-uniform?
Can defects or materials be classified automatically?
APPLICATION EVIDENCE
See the material differently.
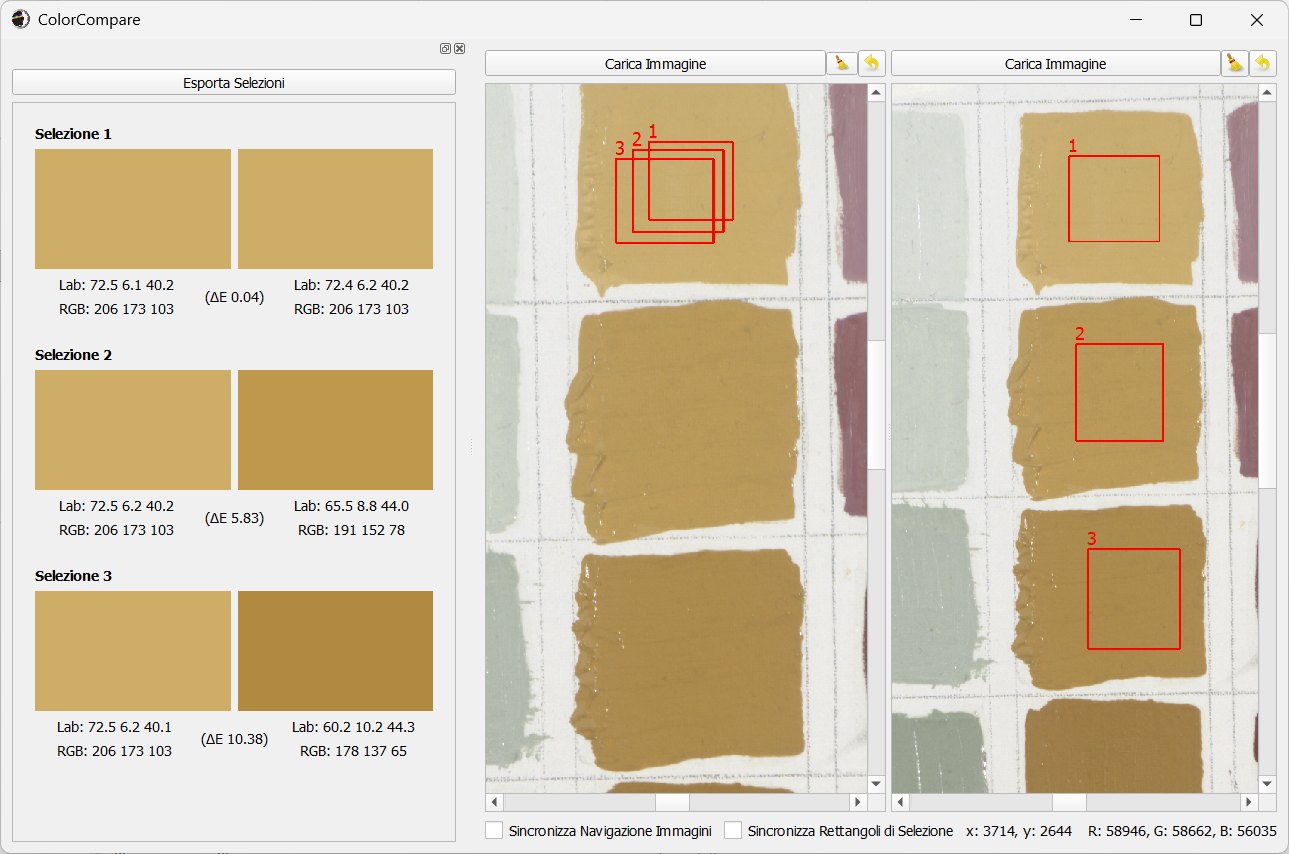
Colorimetric Comparision with Profilocolore ColorCompare application
Click an image to open the full-size view. The media and captions remain editable in Elementor.
Capabilities
01
Inline or laboratory acquisition
Configured around the application and its required evidence.
02
Colorimetric and spectral metrics
Configured around the application and its required evidence.
03
System integration
Configured around the application and its required evidence.
A controlled path from question to evidence.
01
Characterise
Identify samples, variables and the decision threshold.
02
Measure & classify
Acquire calibrated image data and calculate colour, spectral and spatial indicators.
03
Integrate
Deliver repeatable outputs for inspection or classification.
APPLICATION 02 · INDUSTRY & QUALITY CONTROL
Inspection & Classification
Is every product within tolerance—and where is it not?
Application
Measure colour, reflectance, homogeneity and material response across a complete field to reveal defects or classes that conventional inspection can miss.
Operational value: Reduce subjective decisions, detect process drift, limit waste and support repeatable quality control.
Outputs
Colour and reflectance tolerance maps
Defect and non-uniformity layers
Material or product classes
Repeatable inspection reports
Technology path
01
CapturePick
Controls cameras, illumination, filters, file naming and metadata during acquisition.
Turning surface uniformity into repeatable inspection
A line or laboratory inspection system for detecting colour, reflectance and surface differences across every inspected pixel.
The question
Can a surface be classified consistently when subtle defects or non-uniformity are difficult to see and subjective to judge?
01
Subject
Coated, printed, textile or manufactured surfaces
02
Objective
Inspection and classification
03
Output
Pixel-level conformity and anomaly maps
Challenge
Spot measurements describe only a small part of a product, while human inspection varies with operator, illumination and viewing conditions. Production decisions need spatial evidence that can be repeated and compared.
Method
01
Define acceptance criteria
Translate the relevant colour, reflectance, texture or homogeneity requirement into measurable features.
02
Control acquisition
Configure illumination, geometry, wavelength range and field of view for the surface and process speed.
03
Build the classification
Use calibrated image data to distinguish reference behaviour from anomalous or non-conforming regions.
04
Integrate the decision
Export maps, metrics or classifications in a format suited to quality-control and production systems.
Evidence returned
Full-field colour and reflectance values
Spatial uniformity metrics
Anomaly or defect maps
Exportable classification results
Operational value
Full-field measurement replaces an isolated visual impression with documented, image-wide comparison—supporting more consistent inspection and better-informed process decisions.
Technology
HMI / HSI imaging
Controlled illumination
Analysis & classification tools
Integration and training
Process validation
Validate the measurement chain as well as the product.
Profilocolore combines image-wide inspection with laboratory measurement capabilities so thresholds and classifications can be built on controlled data.
CALIBRATE
Sources and sensors
Light sources and imaging sensors can be characterised to reduce variation introduced by the measurement chain.
MEASURE
Materials and surfaces
Radiant power, spectral distributions, luminance and colorimetric differences support repeatable acceptance criteria.
DECIDE
Documented compliance
Inline or laboratory evidence can be translated into classifications, tolerances and reports that remain comparable over time.